Two slots can pay back the same share of what is bet and still feel nothing alike. In one, small wins keep the balance ticking over. In the other, long quiet stretches end, now and then, in a large feature. That difference is volatility, and it has a number.
The number behind the label
Volatility is usually printed as a word: low, medium or high. The word has no agreed scale, so one studio's "high" can be another's "medium". The number underneath it is the standard deviation of one round's result: how far a single round's win typically lands from the average round, measured in bets.
Engine Insights, the public statistics for games on Stake Engine, lists it for each live game, for one Base Game round. These are ours, from the lowest to the highest:
| Game | Standard deviation | Max win | RTP |
|---|---|---|---|
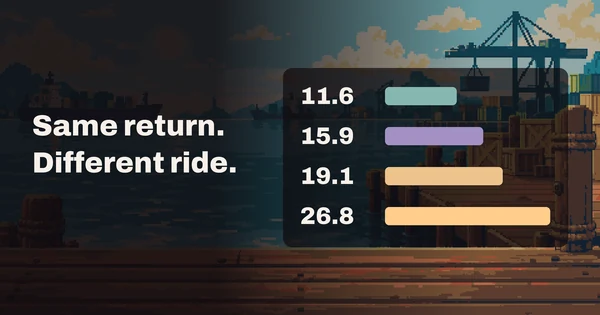
| Kaiju Snack | 11.6× | 10,000× | 96.50% |
| Needle Drop | 12.8× | 25,000× | 96.70% |
| Stompkin HD | 13.4× | 15,000× | 96.50% |
| Clockwork Peacock | 14.3× | 10,000× | 96.70% |
| Mimic Munch | 15.0× | 15,000× | 96.70% |
| Triple Tray | 15.0× | 25,000× | 96.70% |
| Shelf Life | 15.9× | 15,000× | 96.70% |
| Stonewake | 18.8× | 25,000× | 96.70% |
| Rust Rook | 19.1× | 25,000× | 96.70% |
| Neon Eclipse | 19.2× | 10,000× | 96.50% |
| Amethyst Crown | 19.2× | 10,000× | 96.50% |
| Domino Slam | 20.8× | 50,000× | 96.70% |
| Glasswright | 24.1× | 50,000× | 96.70% |
| Crab Cargo | 26.8× | 25,000× | 96.50% |
| Velvet Splice | 26.9× | 15,000× | 96.70% |
| Grumbold's Toll | 37.5× | 100,000× | 96.70% |
Each of these games' pages shows its figure too, under Volatility, next to its RTP and max win. A new game joins the table once Engine Insights has counted its first days of play.
Same return, different ride
RTP says where the average ends up after a very large number of rounds. The standard deviation says how wide the road is on the way there. Two games that pay back nearly the same share can split it very differently: a game near 12 tends to pay more of it as frequent small and medium wins, while a game near 27 keeps more of it for rare large wins, so more rounds in between pay little or nothing.
Neither number promises anything about a single session. They describe the game's maths over every possible round.
What it does to a session
Results add up round by round, and so does their spread. Over a number of rounds, the typical swing of the total, one standard deviation of it, is the figure for one round times the square root of the number of rounds. Over 1,000 rounds at a bet of 1:
- at a standard deviation of 10, the total typically swings about 320 bets either side of the average;
- at 25, about 790 bets either side.
The average itself is the same small loss in both: a game that pays back about 96.5% of what is bet keeps about 35 of every 1,000 bets.
The swing is lopsided. The large wins that push the standard deviation up are rare, so most sessions finish below the average and a few finish far above it. The higher the figure, the more pronounced that is.
The cap is part of it, not all of it
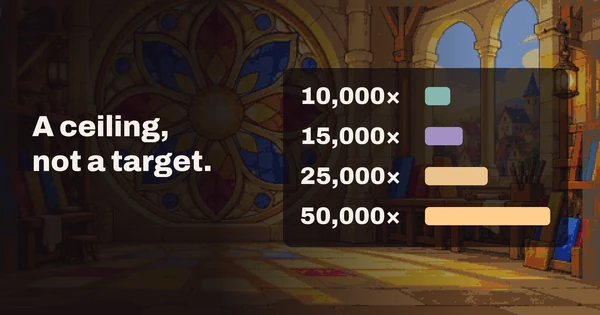
A higher max win allows larger rare wins, and those push the standard deviation up. But how often the large wins come matters as much as how large they can be. In the table, Glasswright has one of our highest caps, yet two games with lower caps sit above it. What a max win cap means covers what the ceiling counts and what happens when a round reaches it.
A bonus buy is a different bet
The figures are for one Base Game round. Buying a feature is a round of its own that costs many times the bet, with its own spread. Bonus buys and boosted bets explains what each mode costs and what changes.
Reading it before you play
- A lower figure: smaller, more frequent wins; the balance moves slowly in both directions.
- A higher figure: longer quiet runs and rarer large wins; the balance can fall further before a win arrives.
- Neither changes the average: plan your budget for the swing, not only for the size of the bet, and stop when it is spent.
We measure every game's maths before release; how we test slot math describes how.
To compare games by this figure, our catalog of every Engine game lists the most volatile and the steadiest of them, each with its standard deviation.